

HARRISBURG, Pa. – The Department of Health confirmed 356 new Coronavirus cases have been reported as of noon, Monday, June 1, bringing the statewide total to 72,282. There are 5,567 total deaths attributed to COVID-19.
There are 389,431 patients who have tested negative. With commercial labs being the primary testing option for most Pennsylvanians, data is not available on the total number of tests pending.
The PA DOH is also reporting that as of noon, June 1, 67% patients have recovered.
New Statewide Positive Cases Last 7 Days
6/1/20 – 356
5/31/20 – 511
5/30/20 – 680
5/29/20 – 693
5/28/20 – 625
5/27/20 – 780
5/26/20 – 451
5/25/20 – 473
LOCAL REGION
| County | Previous Total | New Cases | Total Cases | Total Deaths |
|---|---|---|---|---|
| Armstrong | 62 | 0 | 62 | 4 |
| Butler | 230 | 0 | 230 | 12 |
| Clarion | 27 | 0 | 27 | 2 |
| Clearfield | 39 | 1 | 40 | 0 |
| Crawford | 29 | 0 | 29 | 0 |
| Elk | 6 | 0 | 6 | 0 |
| Forest | 7 | 0 | 7 | 0 |
| Indiana | 91 | 0 | 91 | 5 |
| Jefferson | 9 | 0 | 9 | 0 |
| McKean | 12 | 0 | 12 | 1 |
| Mercer | 107 | 0 | 107 | 5 |
| Venango | 9 | 0 | 9 | 0 |
| Warren | 3 | 0 | 3 | 0 |
Case Counts, Deaths, and Negatives
| Total Cases* | Deaths | Negative** | Recovered*** |
| 72,282 | 5,567 | 389,431 | 67% |
* Total case counts include confirmed and probable cases.
** Negative case data only includes negative PCR tests. Negative case data does not include negative antibody tests.
*** Individuals who have recovered is determined using a calculation, similar to what is being done by several other states. If a case has not been reported as a death, and it is more than 30 days past the date of their first positive test (or onset of symptoms) then an individual is considered recovered.
| Confirmed Cases | Probable Case by Definition and High-Risk Exposure | Probable Case by Serology Test and Either Symptoms or High-Risk Exposure |
| 70,278 | 2,004 | 616 |
Hospital Data
- View hospital data (desktop version)
- View hospital data (mobile version)
Trajectory Animations
Positive Cases by Age Range to Date
| Age Range | Percent of Cases* |
| 0-4 | < 1% |
| 5-12 | < 1% |
| 13-18 | 2% |
| 19-24 | 6% |
| 25-49 | 37% |
| 50-64 | 25% |
| 65+ | 28% |
* Percentages may not total 100% due to rounding
Hospitalization Rates by Age Range to Date
| Age Range | Percent of Cases* |
| 0-4 | < 1% |
| 5-12 | < 1% |
| 13-18 | < 1% |
| 19-24 | 1% |
| 25-49 | 16% |
| 50-64 | 26% |
| 65+ | 56% |
* Percentages may not total 100% due to rounding
Death Data
County Case Counts to Date
| County | Total Cases | Negatives |
| Adams | 250 | 3116 |
| Allegheny | 1919 | 30871 |
| Armstrong | 62 | 1264 |
| Beaver | 590 | 3838 |
| Bedford | 40 | 786 |
| Berks | 4074 | 12467 |
| Blair | 50 | 2891 |
| Bradford | 46 | 1572 |
| Bucks | 5100 | 20385 |
| Butler | 230 | 3771 |
| Cambria | 58 | 3931 |
| Cameron | 2 | 130 |
| Carbon | 237 | 2432 |
| Centre | 154 | 2192 |
| Chester | 2784 | 13449 |
| Clarion | 27 | 680 |
| Clearfield | 40 | 1138 |
| Clinton | 57 | 644 |
| Columbia | 348 | 1391 |
| Crawford | 29 | 1098 |
| Cumberland | 635 | 5772 |
| Dauphin | 1303 | 10336 |
| Delaware | 6481 | 21789 |
| Elk | 6 | 331 |
| Erie | 295 | 5392 |
| Fayette | 95 | 3435 |
| Forest | 7 | 86 |
| Franklin | 777 | 5259 |
| Fulton | 15 | 231 |
| Greene | 27 | 806 |
| Huntingdon | 231 | 890 |
| Indiana | 91 | 1446 |
| Jefferson | 9 | 531 |
| Juniata | 95 | 355 |
| Lackawanna | 1551 | 6364 |
| Lancaster | 3189 | 16492 |
| Lawrence | 80 | 1377 |
| Lebanon | 972 | 4638 |
| Lehigh | 3770 | 14630 |
| Luzerne | 2739 | 11272 |
| Lycoming | 164 | 2345 |
| McKean | 12 | 639 |
| Mercer | 107 | 1656 |
| Mifflin | 59 | 1276 |
| Monroe | 1320 | 6091 |
| Montgomery | 7093 | 35580 |
| Montour | 53 | 3286 |
| Northampton | 3082 | 13793 |
| Northumberland | 194 | 1464 |
| Perry | 61 | 786 |
| Philadelphia | 18517 | 59919 |
| Pike | 477 | 2046 |
| Potter | 4 | 153 |
| Schuylkill | 631 | 5146 |
| Snyder | 45 | 416 |
| Somerset | 38 | 1881 |
| Sullivan | 3 | 97 |
| Susquehanna | 110 | 822 |
| Tioga | 17 | 576 |
| Union | 62 | 1199 |
| Venango | 9 | 565 |
| Warren | 3 | 400 |
| Washington | 140 | 4563 |
| Wayne | 120 | 1078 |
| Westmoreland | 449 | 9723 |
| Wyoming | 34 | 512 |
| York | 1013 | 13941 |
Incidence by County
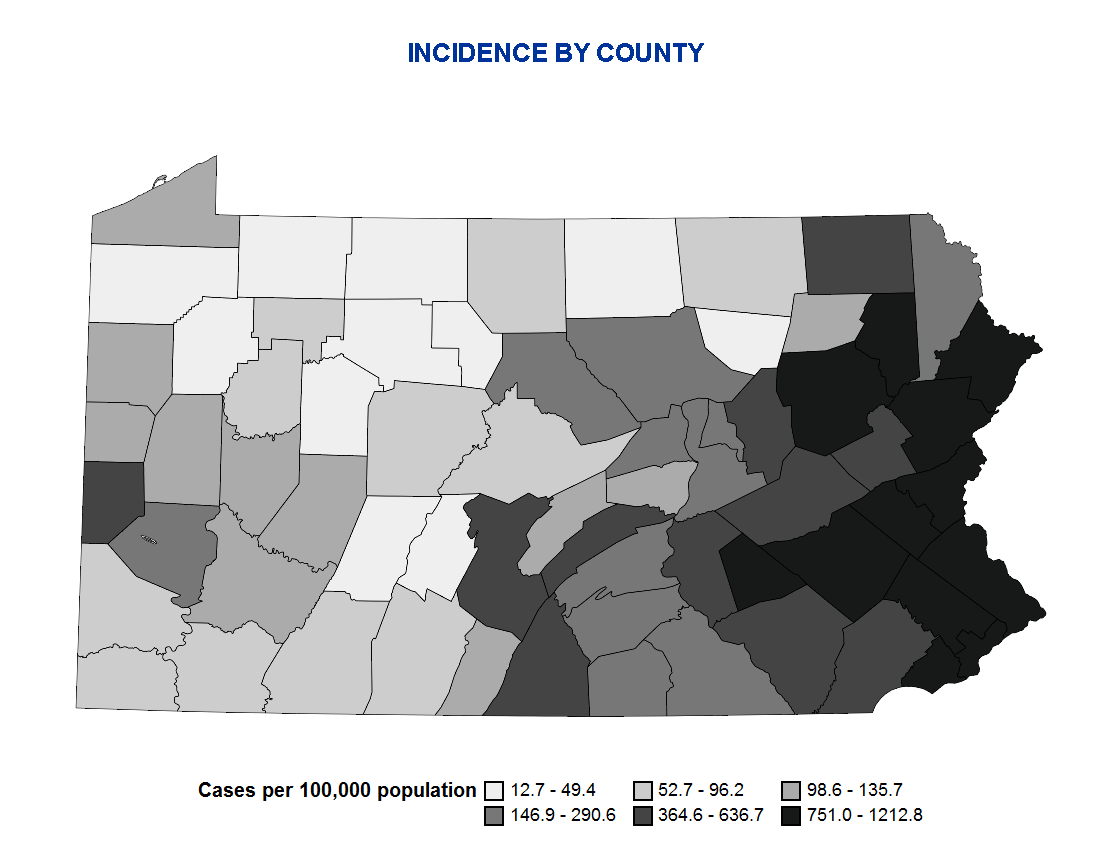 Incidence is calculated by dividing the current number of confirmed and probable COVID-19 cases reported to the Department by the 2018 county population data available from the Bureau of Health Statistics. The counties are divided into 6 relatively equally-sized groups based on their incidence rate (i.e. sestiles). Cases are determined using a national COVID-19 case definition. There currently is no way to estimate the true number of infected persons. Incidence rates are based on the number of known cases, not the number of true infected persons.
Case Counts by Sex to Date
| Sex | Positive Cases | Percent of Cases |
| Female | 39,624 | 55% |
| Male | 31,946 | 44% |
| Neither | 3 | 0% |
| Not reported | 709 | 1% |
* Percentages may not total 100% due to rounding
Case Counts by Race to Date*
| Race | Positive Cases | Percent of Cases |
| African American/Black | 8835 | 12% |
| Asian | 1041 | 1% |
| White | 19,986 | 28% |
| Other | 441 | 1% |
| Not reported | 41,979 | 58% |
* 58% of race is not reported. Little data is available on ethnicity. ** Percentages may not total 100% due to rounding
Case Counts by Region to Date
| Region | Positive | Negative | Inconclusive |
| Northcentral | 1070 | 15335 | 17 |
| Northeast | 13131 | 59040 | 166 |
| Northwest | 534 | 14023 | 20 |
| Southcentral | 5309 | 50277 | 82 |
| Southeast | 46766 | 185227 | 977 |
| Southwest | 3468 | 65529 | 45 |
EpiCurve by Region
Case counts are displayed by the date that the cases were first reported to the PA-NEDSS surveillance system. Case counts by date of report can vary significantly from day to day for a variety of reasons. In addition to changes due to actual changes in disease incidence, trends are strongly influenced by testing patterns (who gets tested and why), testing availability, lab analysis backlogs, lab reporting delays, new labs joining our electronic laboratory reporting system, mass screenings, etc. Trends need to be sustained for at least 2-3 weeks before any conclusions can be made regarding the progress of the pandemic.
COVID-19 Cases Associated with Nursing Homes and Personal Care Homes to Date
This data represents long-term care facilities in Pennsylvania, including Department of Health and Department of Human Services regulated facilities.
- COVID-19 Long-Term Care Facilities Data (updated 5/26/2020 at 3:30 p.m.)
More data is available here.
For the latest information for individuals, families, businesses and schools, visit “Responding to COVID-19” on pa.gov.
Click here to see the actions taken by the Wolf Administration as of noon, Monday, June 1, 2020, in response to the Coronavirus Pandemic.
The Wolf Administration stresses the role Pennsylvanians play in helping to reduce the spread of COVID-19:· Wash your hands with soap and water for at least 20 seconds or use hand sanitizer if soap and water are not available.· Cover any coughs or sneezes with your elbow, not your hands.· Clean surfaces frequently.· Stay home to avoid spreading COVID-19, especially if you are unwell.All Pennsylvania residents are encouraged to sign up for AlertPA, a text notification system for health, weather, and other important alerts like COVID-19 updates from Commonwealth agencies. Residents can sign up online at www.ready.pa.gov/BeInformed/Signup-For-Alerts.